Short Answer
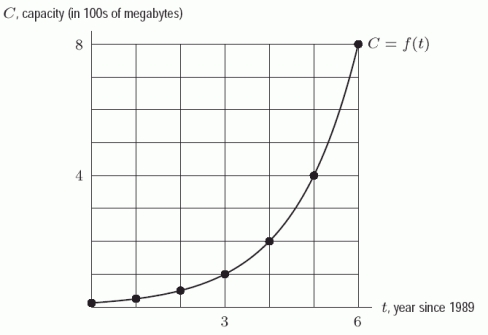
The following figure gives the graph of  , where C is the computer hard disk capacity (in hundreds of megabytes) that could be bought for $500 t years past 1989. If the trend displayed in the graph continued, in what year would the capacity that can be bought for $500 be 9700?
Correct Answer:

Verified
Correct Answer:
Verified
Q34: A store's sales of cassette tapes of
Q35: The amount of pollution in a harbor
Q36: Find a possible formula for the exponential
Q37: An ant population grows at a continuous
Q38: The graph of <img src="https://d2lvgg3v3hfg70.cloudfront.net/TB10073/.jpg" alt="The
Q40: An investment grows by 1.4% per year
Q41: Which of the following is correctly ordered
Q42: For an account paying 9% annual interest,
Q43: A population is 150,000 in year t
Q44: An investment decreases by 20% over a