Multiple Choice
The graph below shows the quantity of a drug in a patient's bloodstream over a period of time t, in minutes.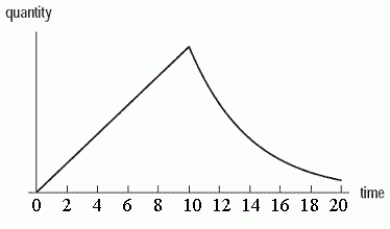 Which of the following scenarios best describes the graph?
A) The drug is injected over a 10 minute interval, during which the quantity increases linearly. After the 10 minutes, the injection is discontinued and the quantity then decays exponentially.
B) The drug is injected over a 10 minute interval, during which the quantity increases exponentially. After the 10 minutes, the injection is discontinued and the quantity then decays linearly.
C) The drug is injected all at once. The quantity first increases and then decreases linearly.
D) The drug is injected all at once. The quantity first increases and then decreases exponentially.
Correct Answer:

Verified
Correct Answer:
Verified
Q64: Write a formula that gives the value
Q65: You invest $6000 in an account earning
Q66: What is the horizontal asymptote of <img
Q67: A population has size 2300 at time
Q68: Assume that all important features are shown
Q70: The population of a city is increasing
Q71: The graph of the exponential function
Q72: Is the formula for a function representing
Q73: <img src="https://d2lvgg3v3hfg70.cloudfront.net/TB10073/.jpg" alt=" " class="answers-bank-image
Q74: The population of a city is increasing