Multiple Choice
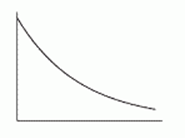
The quantity of the drug in a patient's bloodstream increased at a decreasing rate until it reached saturation. Which of the following graphs shows the quantity of drug in the blood graphed against time?
A) 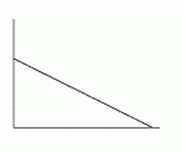
B) 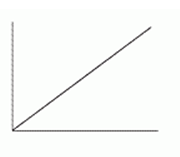
C)
D) 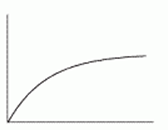
E) 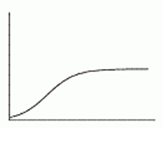
F) 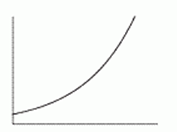
Correct Answer:

Verified
Correct Answer:
Verified
Q76: Sketch a graph of <img src="https://d2lvgg3v3hfg70.cloudfront.net/TB10073/.jpg" alt="Sketch
Q77: Assume that height is a function of
Q78: A supermarket only sells cans of soda
Q79: Given the following table of values, can
Q80: What are the units of <img
Q82: The data points for the following table
Q83: Evaluate <img src="https://d2lvgg3v3hfg70.cloudfront.net/TB10073/.jpg" alt="Evaluate
Q84: Suppose <img src="https://d2lvgg3v3hfg70.cloudfront.net/TB10073/.jpg" alt="Suppose
Q85: Calculate successive rates of change for the
Q86: ComGas, the Cambridge power company, charges its