Short Answer
Determine the concavity of the graph of 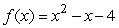 between x = 0 and x = 3 by calculating average rates of change over intervals of length 1. Is the graph concave up or concave down?
Correct Answer:

Verified
Correct Answer:
Verified
Q82: The data points for the following table
Q83: Evaluate <img src="https://d2lvgg3v3hfg70.cloudfront.net/TB10073/.jpg" alt="Evaluate
Q84: Suppose <img src="https://d2lvgg3v3hfg70.cloudfront.net/TB10073/.jpg" alt="Suppose
Q85: Calculate successive rates of change for the
Q86: ComGas, the Cambridge power company, charges its
Q88: The rumor spread slowly--then faster--then slowly again.
Q89: <img src="https://d2lvgg3v3hfg70.cloudfront.net/TB10073/.jpg" alt=" " class="answers-bank-image d-block" rel="preload"
Q90: The graph of <img src="https://d2lvgg3v3hfg70.cloudfront.net/TB10073/.jpg" alt="The graph
Q91: Find the domain of the function <img
Q92: Let <img src="https://d2lvgg3v3hfg70.cloudfront.net/TB10073/.jpg" alt="Let