Short Answer
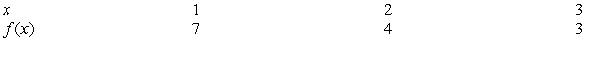
Use the following chart containing values of  to determine whether the function appears to be:
a) increasing or decreasing
b) concave up or concave down
Correct Answer:

Verified
a) increas...View Answer
Unlock this answer now
Get Access to more Verified Answers free of charge
Correct Answer:
Verified
View Answer
Unlock this answer now
Get Access to more Verified Answers free of charge
Q1: Let <img src="https://d2lvgg3v3hfg70.cloudfront.net/TB10073/.jpg" alt="Let Be a
Q2: Let <img src="https://d2lvgg3v3hfg70.cloudfront.net/TB10073/.jpg" alt="Let .
Q3: If <img src="https://d2lvgg3v3hfg70.cloudfront.net/TB10073/.jpg" alt="If
Q5: If <img src="https://d2lvgg3v3hfg70.cloudfront.net/TB10073/.jpg" alt="If
Q6: Calculate successive rates of change for the
Q7: Let <br> <img src="https://d2lvgg3v3hfg70.cloudfront.net/TB10073/.jpg" alt="Let
Q8: Use the following chart containing values of
Q9: Fred's cell phone company charges $55 per
Q10: Suppose that your uncle Gerald has just
Q11: Graph <img src="https://d2lvgg3v3hfg70.cloudfront.net/TB10073/.jpg" alt="Graph