Short Answer
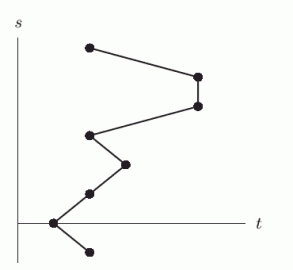
The data points for the following table are graphed in the figures below. 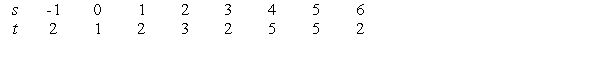
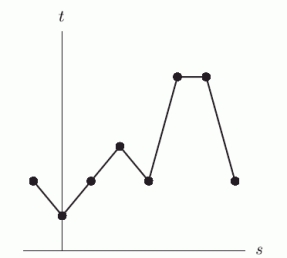
 For the graph that is a function, we could write _____ = f ( _____ ), where _____ is the dependent variable and _____ is the independent variable. (Fill in each blank with an "s" or a "t").
Correct Answer:

Verified
Correct Answer:
Verified
Q52: Let <img src="https://d2lvgg3v3hfg70.cloudfront.net/TB10073/.jpg" alt="Let Give the
Q53: The probability of being in an accident
Q54: In the following graph, is m a
Q55: A T-shirt printing company charges a set-up
Q56: Solve <img src="https://d2lvgg3v3hfg70.cloudfront.net/TB10073/.jpg" alt="Solve " class="answers-bank-image
Q58: Given <img src="https://d2lvgg3v3hfg70.cloudfront.net/TB10073/.jpg" alt="Given A)
Q59: An organization has 200 raffle tickets to
Q60: Let <img src="https://d2lvgg3v3hfg70.cloudfront.net/TB10073/.jpg" alt="Let Give the
Q61: A supermarket only sells cans of soda
Q62: What is the domain of the function