Short Answer
The data points for the following table are graphed in the figure below. 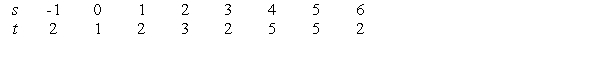
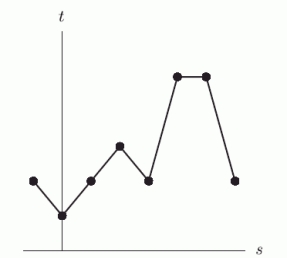
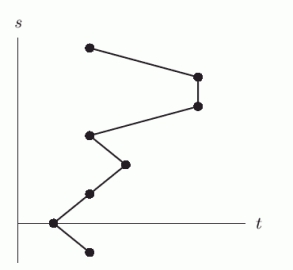
For the graph that is a function, approximate  .
.
Correct Answer:

Verified
Correct Answer:
Verified
Q17: If <img src="https://d2lvgg3v3hfg70.cloudfront.net/TB10073/.jpg" alt=" If
Q18: Find the domain of the function
Q19: Let <img src="https://d2lvgg3v3hfg70.cloudfront.net/TB10073/.jpg" alt="Let . What
Q20: Which of the following are not in
Q21: Let <img src="https://d2lvgg3v3hfg70.cloudfront.net/TB10073/.jpg" alt="Let
Q23: Find a formula for the following graph:<br>
Q24: Evaluate <br> <img src="https://d2lvgg3v3hfg70.cloudfront.net/TB10073/.jpg" alt="Evaluate
Q25: If <img src="https://d2lvgg3v3hfg70.cloudfront.net/TB10073/.jpg" alt="If , what
Q26: For <img src="https://d2lvgg3v3hfg70.cloudfront.net/TB10073/.jpg" alt="For , what
Q27: The number of cancer cells in a