True/False
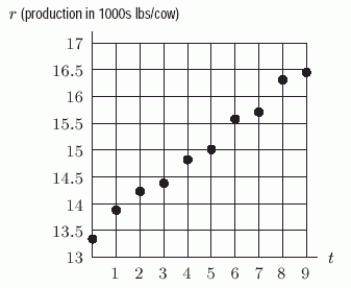
The following figure gives the annual amount of milk produced (in 1000s of pounds) per US milk cow as a function of t, the number of years since 1986. Is the regression line r = 0.34t + 13.4 reasonably correct?
Correct Answer:

Verified
Correct Answer:
Verified
Related Questions
Q103: What is the formula for the line
Q104: A car company has found that there
Q105: The formula for the line intersecting the
Q106: Find a formula for the linear function
Q107: An airplane has room for 330 coach-fare
Q109: The following table gives the number P
Q110: The distance traveled by a car is
Q111: Several years ago, the wild rabbits of
Q112: The following chart gives the number of
Q113: If <img src="https://d2lvgg3v3hfg70.cloudfront.net/TB10073/.jpg" alt="If is