Multiple Choice
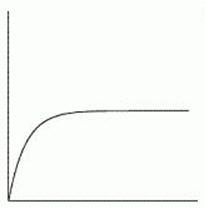
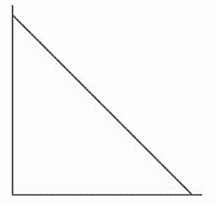
Which of the following graphs is mostly likely to represent the number of bacteria in a sample with an unlimited food supply and unlimited space?
A) 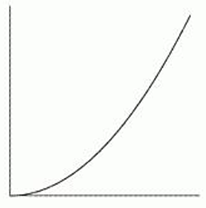
B) 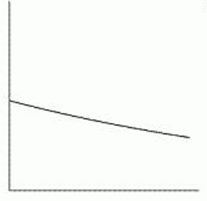
C) 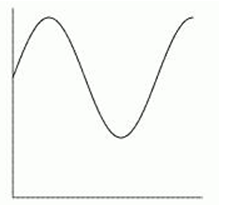
D) 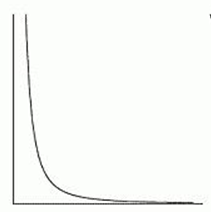
E)
F)
Correct Answer:

Verified
Correct Answer:
Verified
Q23: The table below gives the deer population
Q24: Suppose there are 120 people living in
Q25: If <img src="https://d2lvgg3v3hfg70.cloudfront.net/TB10073/.jpg" alt="If and
Q26: Does an <img src="https://d2lvgg3v3hfg70.cloudfront.net/TB10073/.jpg" alt="Does an
Q27: At a price of $2.55 per gallon,
Q29: It costs a band $900 to pay
Q30: If the equation <img src="https://d2lvgg3v3hfg70.cloudfront.net/TB10073/.jpg" alt="If
Q31: A salesman earns <img src="https://d2lvgg3v3hfg70.cloudfront.net/TB10073/.jpg" alt="A salesman
Q32: Farmer Brown starts with 110 cows and
Q33: Solve <img src="https://d2lvgg3v3hfg70.cloudfront.net/TB10073/.jpg" alt="Solve