Multiple Choice
The following table shows the enrollment in a private college for the years 1996 to 2005. Interpret these figures as partial sums,  , of terms of a sequence,
 , where n is the number of years since 1995 (so
 , etc.) .
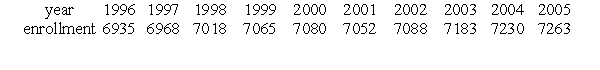 Which of the following gives the change in enrollment between 1997 and 1998?
A) 
B) 
C) 
D) 
Correct Answer:

Verified
Correct Answer:
Verified
Q59: What is the 13<sup>th</sup> term of the
Q60: What is the present value of a
Q61: A patient takes 600 mg of a
Q62: A person decides to walk for 16
Q63: Does <img src="https://d2lvgg3v3hfg70.cloudfront.net/TB10073/.jpg" alt="Does
Q65: A child building a tower with blocks
Q66: Does the infinite geometric series <img src="https://d2lvgg3v3hfg70.cloudfront.net/TB10073/.jpg"
Q67: Is the following sequence arithmetic, geometric, or
Q68: If <img src="https://d2lvgg3v3hfg70.cloudfront.net/TB10073/.jpg" alt="If
Q69: Is <img src="https://d2lvgg3v3hfg70.cloudfront.net/TB10073/.jpg" alt="Is