Multiple Choice
The following table shows the enrollment in a private college for the years 1996 to 2005. Interpret these figures as partial sums,  , of terms of a sequence,
  , where n is the number of years since 1995 (so
 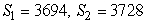 , etc.) .
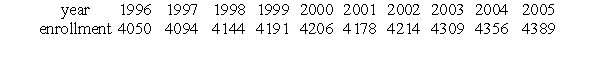 Which of the following gives the average enrollment between 2000 and 2003?
A) 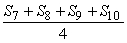
B) 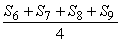
C) 
D) 
Correct Answer:

Verified
Correct Answer:
Verified
Related Questions
Q52: Let <img src="https://d2lvgg3v3hfg70.cloudfront.net/TB10073/.jpg" alt="Let
Q53: Your doctor tells you to take 37
Q54: How many terms are there in the
Q55: An employee is offered a salary of
Q56: Find the sum of the series: <img
Q58: What is the present value of a
Q59: What is the 13<sup>th</sup> term of the
Q60: What is the present value of a
Q61: A patient takes 600 mg of a
Q62: A person decides to walk for 16