Multiple Choice
The following table shows the enrollment in a private college for the years 1996 to 2005. Interpret these figures as partial sums,  , of terms of a sequence,
 , where n is the number of years since 1995 (so
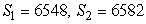 , etc.) .
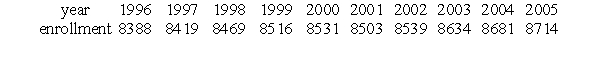 Which of the following gives the average change in enrollment between 1998 and 2002?
A) 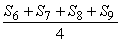
B) 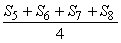
C) 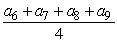
D) 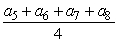
Correct Answer:

Verified
Correct Answer:
Verified
Q71: If <img src="https://d2lvgg3v3hfg70.cloudfront.net/TB10073/.jpg" alt="If
Q72: A person decides to walk for 15
Q73: Does <img src="https://d2lvgg3v3hfg70.cloudfront.net/TB10073/.jpg" alt="Does
Q74: A new employee is offered two salary
Q75: Find the sum of the series <br>
Q76: For the arithmetic sequence <img src="https://d2lvgg3v3hfg70.cloudfront.net/TB10073/.jpg"
Q77: If <img src="https://d2lvgg3v3hfg70.cloudfront.net/TB10073/.jpg" alt="If
Q79: Does <img src="https://d2lvgg3v3hfg70.cloudfront.net/TB10073/.jpg" alt="Does
Q80: Write <img src="https://d2lvgg3v3hfg70.cloudfront.net/TB10073/.jpg" alt="Write
Q81: The repeating decimal 0.848484. . . can