Short Answer
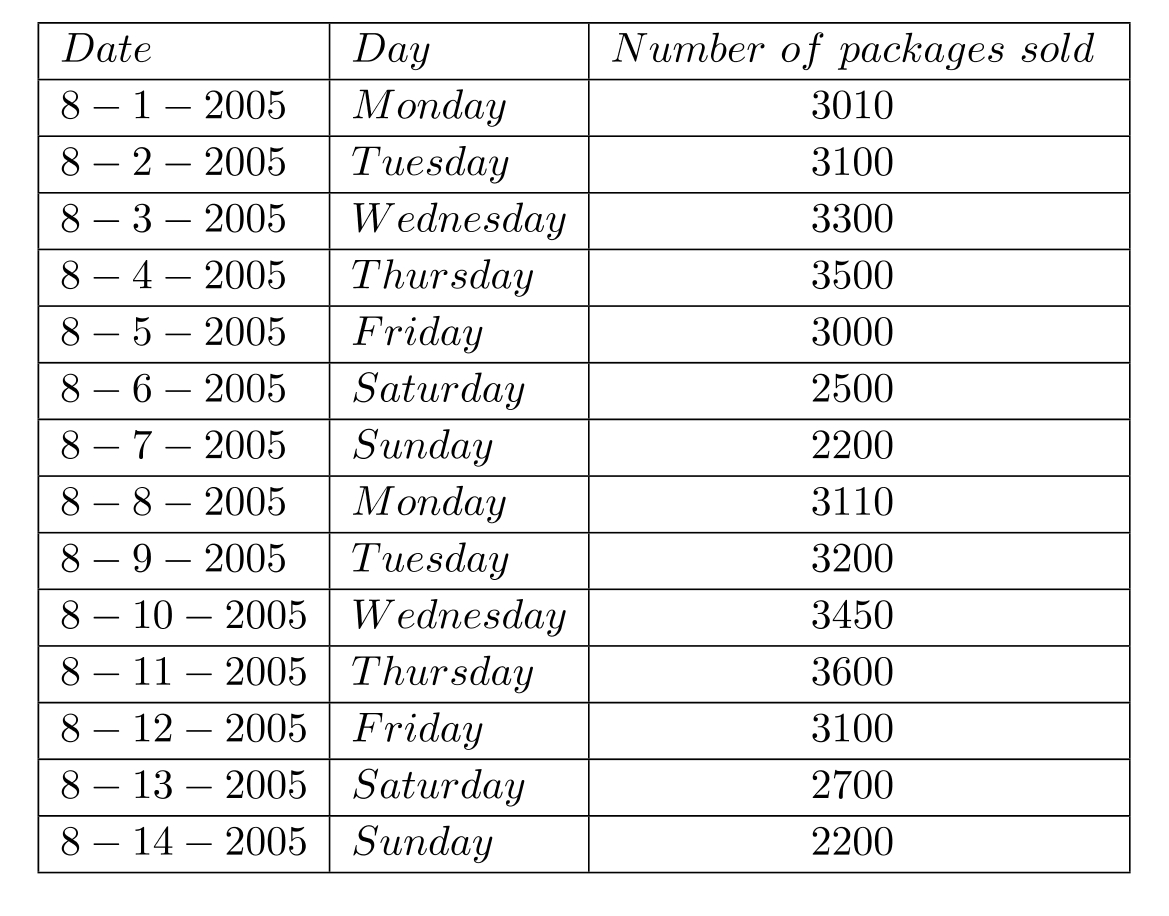
Demand data for number of packed food sold by Advanced Airlines on each day of the first two weeks of August 2005 is given in the table below.

(A) Using the centered moving average method, generate a set of centered moving averages using , the number of periods set to 3 .
(B) Fit a trend line for the centered moving average data, using for 8-1-2005.
(C) Estimate seasonal index Monday.
(D) Make a seasonally adjusted trend line forecast for 8-15-2005.
Correct Answer:

Verified
(A) 
(B) Trend line...View Answer
Unlock this answer now
Get Access to more Verified Answers free of charge
Correct Answer:
Verified
(B) Trend line...
View Answer
Unlock this answer now
Get Access to more Verified Answers free of charge
Q4: For the data <span class="ql-formula"
Q5: An automatic traffic counter is set to
Q6: For the data <span class="ql-formula"
Q7: For the data <span class="ql-formula"
Q8: Seasonality indices (seasonal relatives) can be calculated
Q10: For the data <span class="ql-formula"
Q11: One period moving average for any set
Q12: For the data <span class="ql-formula"
Q13: In exponential smoothing the sum of the
Q14: For the data <span class="ql-formula"