Short Answer
The following graph represents the annual operating expenses and the annual sales (both in $1,000s) for a new graphics business.
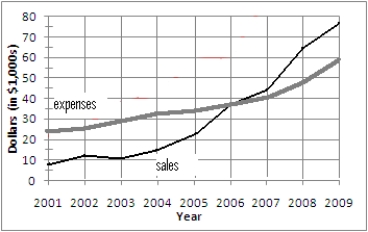
In what year did sales finally equal expenses?
Correct Answer:

Verified
Correct Answer:
Verified
Q25: Determine whether <img src="https://d2lvgg3v3hfg70.cloudfront.net/TB9987/.jpg" alt="Determine whether
Q26: Determine the number of solutions of the
Q27: Solve the system of equations using elimination.<br>3x
Q28: State whether the system of equations has
Q29: On the grid provided, graph and shade
Q31: Evaluate the piecewise function.<br> <img src="https://d2lvgg3v3hfg70.cloudfront.net/TB9987/.jpg" alt="Evaluate
Q32: Use the graph to find the value
Q33: Solve the system by elimination.<br> <img src="https://d2lvgg3v3hfg70.cloudfront.net/TB9987/.jpg"
Q34: Solve the system by substitution.<br> <img src="https://d2lvgg3v3hfg70.cloudfront.net/TB9987/.jpg"
Q35: Solve the system.<br> <img src="https://d2lvgg3v3hfg70.cloudfront.net/TB9987/.jpg" alt="Solve the