Short Answer
The graph below displays the population of the Madison, WI by decade.
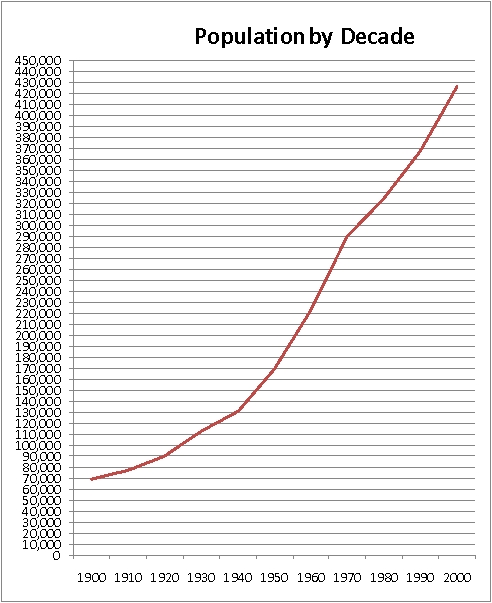
Find:
A) The total change from 1940 to 1980. Round answer to the nearest ten-thousand.
B) The average rate of change from 1940 to 1980. Round answer to 2 decimal places if necessary.
Correct Answer:

Verified
A. 190,000...View Answer
Unlock this answer now
Get Access to more Verified Answers free of charge
Correct Answer:
Verified
View Answer
Unlock this answer now
Get Access to more Verified Answers free of charge
Q129: A contractor purchases a piece of equipment
Q130: In the first 8 years of his
Q131: Identify A) the slope and B) the
Q132: Determine whether the following data is linear.<br><img
Q133: The joint plates of a wooden truss
Q135: The number of nails required to hold
Q136: Find the equation to describe the data
Q137: Use an estimate of a linear model
Q138: The amount of weight that can be
Q139: Write the equation of the line perpendicular