Multiple Choice
Use the following to answer questions
The following graph shows the percent of families in the U.S. living below the poverty level by year.
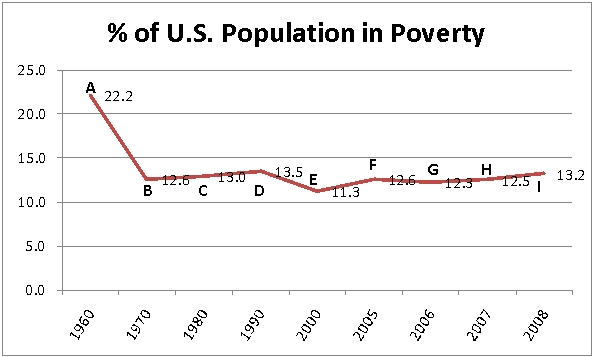
-Which pair of points would be used to show the most rapid increase in the number of families living in poverty?
A) B to D
B) C to D
C) E to F
D) H to I
Correct Answer:

Verified
Correct Answer:
Verified
Q48: A house that sold for $35,000 in
Q49: Which function pictured has the largest slope?<br><img
Q50: The function, <img src="https://d2lvgg3v3hfg70.cloudfront.net/TB9987/.jpg" alt="The function,
Q51: The table below is a data set
Q52: Which choice best describes the function, <img
Q54: Use the following to answer questions <br>The
Q55: The following table gives the average daily
Q56: The joint plates of a wooden truss
Q57: Assuming that the line through the given
Q58: The table below gives a girl's height