Short Answer
Use the following to answer questions
The following graph shows the percent of families in the U.S. living below the poverty level by year.
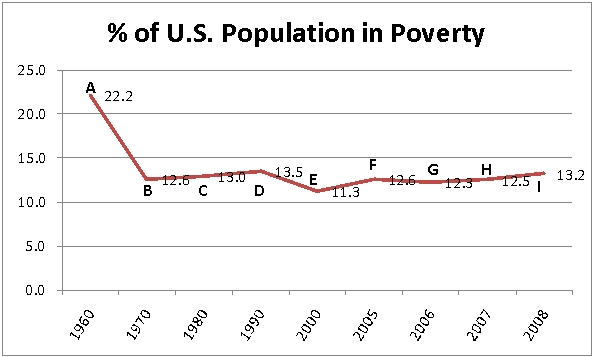
-What is the rate of change in families living in poverty from B to I? (Round the answer to 3 decimal places.)
Correct Answer:

Verified
Correct Answer:
Verified
Q60: Construct an equation of the form y
Q61: Choose the equation that matches the graph.<br><img
Q62: The following equation represents the best-fit regression
Q63: The function, <img src="https://d2lvgg3v3hfg70.cloudfront.net/TB9987/.jpg" alt="The function,
Q64: Which function pictured has the largest slope?<br><img
Q66: Given the data below concerning oil prices,
Q67: The attendance at a band's concerts has
Q68: Jessica works at Acme Manufacturing Company. After
Q69: A house valued at $65,000 in 1988
Q70: Complete the sentence to describe the graph