Essay
The following graph shows the percentage of cars produced each decade by country.
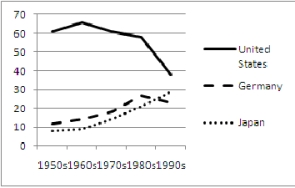 The graph gives the impression that production drastically decreased in the 1990s while this is not really true. What flaw in the construction of the graph leads to this impression?
Correct Answer:

Verified
(Answers may vary slightly. ) Only selec...View Answer
Unlock this answer now
Get Access to more Verified Answers free of charge
Correct Answer:
Verified
View Answer
Unlock this answer now
Get Access to more Verified Answers free of charge
Q145: The number of nails required to hold
Q146: Assuming that the line through the given
Q147: A small business purchases a piece of
Q148: Create the step function from the graph:<br><img
Q149: Use the intercepts to calculate the slope
Q151: The following table shows the number of
Q152: Which line has the steeper slope?<br>A.
Q153: Construct the piecewise linear function for the
Q154: Rewrite the following expression without using an
Q155: Create the graph for the function: <img