Multiple Choice
The frequency table below describes the age distribution of students in a college algebra class. Based on this information, estimate the largest possible value for the mean age of this class.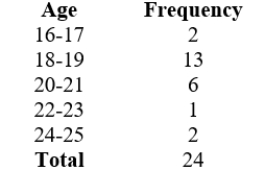
Which of the following is the largest possible mean?
Round your answers to 2 decimals if necessary.
A) 19.00
B) 20.00
C) 19.5
D) 18.5
Correct Answer:

Verified
Correct Answer:
Verified
Q75: Find the domain for this function. Express
Q76: The following table gives the median salary
Q77: Select all of the following ordered pairs
Q78: The following table gives values for a
Q79: Given the graph of velocity as a
Q81: Identify the minimum of this function over
Q82: Missy's excavating charges a set-up fee of
Q83: Find each of the following for the
Q84: The following three graphs describe two cars,
Q85: Over what interval is the function concave