Multiple Choice
Use the graph below to answer the questions.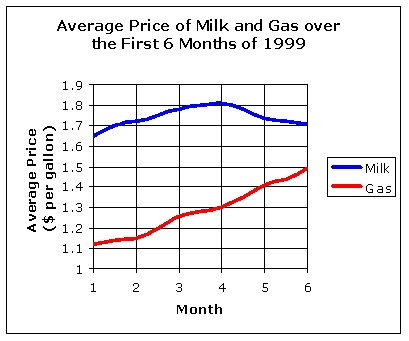
-
In what month did milk prices reach $1.79 per gallon?
A) 2
B) 3
C) 6
D) 4
Correct Answer:

Verified
Correct Answer:
Verified
Related Questions
Q1: Which graph is increasing on the interval
Q2: Use technology to graph the function and
Q3: The following three graphs describe two cars,
Q4: Find the domain of the function, .<br>
Q5: Determine the range of this graph. Express
Q7: Determine if this set of points represents
Q8: The following grid shows the graph of
Q9: Find an equation that represents the relationship
Q10: Find the median of the data set
Q11: Which graph is decreasing on the interval