Multiple Choice
Consider the table giving values for variables s and t.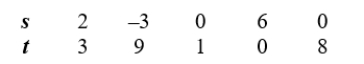
Determine which of the following best describes the relationship between s and t.
A) t is a function of s
B) s is a function of t
C) both A and B
D) None of the above
Correct Answer:

Verified
Correct Answer:
Verified
Related Questions
Q63: The following table gives values for a
Q64: Over what interval is the function concave
Q65: Find the domain for this function. Express
Q66: The area of a circle is described
Q67: Below is age data from a University
Q69: Solve for y as a function of
Q70: Find the value that completes the ordered
Q71: The following grid shows the graph of
Q72: Determine the domain of this graph. Express
Q73: State the interval on which this graph