Multiple Choice
The following diagram shows a firm's short- run cost curves.
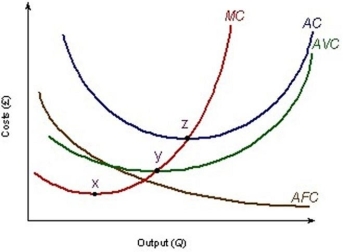 It indicates that diminishing returns set in at point
A) x
B) somewhere between points x and y
C) z
D) y
Correct Answer:

Verified
Correct Answer:
Verified
Related Questions
Q41: Implicit costs are payments that have already
Q42: If a firm decides to produce more
Q43: Which of these statements is false?
Q44: Which of the following is not a
Q45: Which of the following is a fixed
Q47: If the total product of two workers
Q48: If a firm does not include the
Q49: The services that supply an industry are
Q50: Which of the following defines organisational economies?<br>A)
Q51: Which of the following assumptions do we