Multiple Choice
The following diagram shows the demand curve for a product shifting from D0 to D1. Which of the following could have caused this shift? 
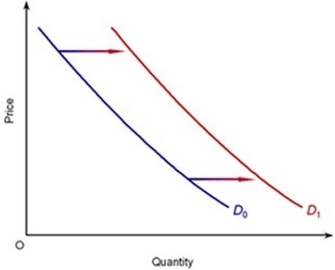
A) A fall in price of the product
B) A fall in price of a substitute product
C) A fall in income if the product is normal
D) A fall in price of a complementary product
Correct Answer:

Verified
Correct Answer:
Verified
Related Questions
Q22: The position at which a demand curve
Q23: The law of demand states that, other
Q24: Which of the following will cause a
Q25: In a perfectly competitive market <br>A) only
Q26: Two goods are complementary if the price
Q28: What might cause a demand curve to
Q29: The supply curve of an inferior good
Q30: Explain how the fall in the market
Q31: If a supply change results in a
Q32: If the market price is below equilibrium,