Multiple Choice
The following diagram shows the demand for and supply of oil. The supply and demand curves are initially given by S0 and D0. The market is in equilibrium at point x. There is then a recession accompanied by political tensions in certain oil- producing countries that adversely affects oil production. As a result either or both the demand and supply curves shift to one of the new positions shown in the diagram. What will be the equilibrium position on the diagram? 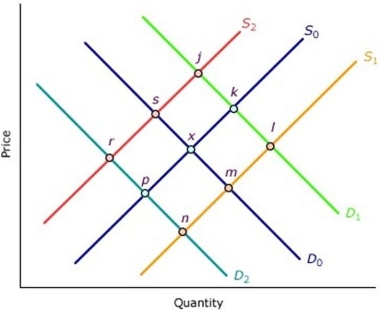
A) Point n
B) Point r
C) Point m
D) Point p
Correct Answer:

Verified
Correct Answer:
Verified
Q61: If interest rates rise, what will happen
Q62: Explain why a demand curve has a
Q63: What is the price system?
Q64: If a market is trading at an
Q65: A fall in hourly wages would cause
Q67: When excess supply occurs in a free
Q68: Assume that there is a rise in
Q69: If house owners expect house prices to
Q70: Explain why a supply curve has a
Q71: A good whose demand falls when people's