Multiple Choice
The following diagram shows the demand for and supply of apples. The supply and demand curves are initially given by S0 and D0. The market is in equilibrium at point x. There is then a rise in the price of pears and oranges and an increase in the costs of transporting fresh fruit. As a result either or both the demand and supply curves shift to one of the new positions shown in the diagram. What will be the equilibrium position on the diagram? 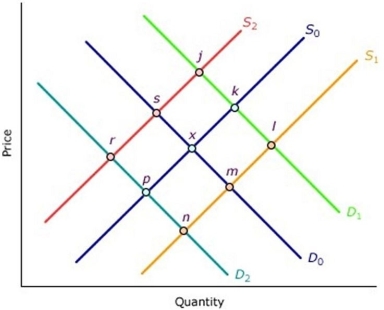
A) Point l
B) Point r
C) Point j
D) Point n
Correct Answer:

Verified
Correct Answer:
Verified
Q53: The cost of pressing DVDs has fallen.
Q54: In a free market, if there is
Q55: House prices, like all prices, are determined
Q56: The price of blue staplers rises and
Q57: A good harvest will cause<br>A) a rightward
Q59: If a determinant of supply changes, other
Q60: If there is a shortage in a
Q61: If interest rates rise, what will happen
Q62: Explain why a demand curve has a
Q63: What is the price system?