Multiple Choice
The following diagram shows the foreign exchange market for sterling.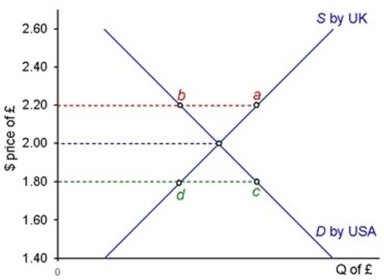 At an exchange rate of $2.20 there is
A) a shortage of pounds of a- b.
B) an excess supply of pounds of a- b.
C) an overvalued exchange rate of 40 cents.
D) an excess demand for dollars of c- d.
Correct Answer:

Verified
Correct Answer:
Verified
Related Questions
Q96: Match the List to each of the
Q97: If the inflation rate falls in the
Q98: If neither changes in interest rates nor
Q99: If two countries have fixed their exchange
Q100: In a free foreign exchange market the
Q102: Which of the following options were possible
Q103: Which one of the following would cause
Q104: An exchange rate regime where rates are
Q105: The balance of payments is made up
Q106: Assume that, under a floating exchange rate