Multiple Choice
The following diagram shows cost and revenue curves of a monopolist.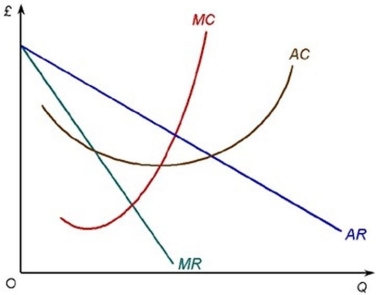 The firm will produce at an output where
A) MC = AR
B) MC = MR
C) MC = AC
D) MR = AC
Correct Answer:

Verified
Correct Answer:
Verified
Related Questions
Q7: Why is costless exit so important in
Q8: A monopolist will always sell in the
Q9: The fast food industry is not considered
Q10: Economies of scope occur when a firm's
Q11: A 5- firm concentration ratio shows
Q13: You live in a small town where
Q14: The degree of competition in an industry
Q15: Which of the following statements about contestable
Q16: The wool industry is a perfectly competitive
Q17: The assumption of free entry implies that<br>A)