Multiple Choice
What does the figure illustrate? 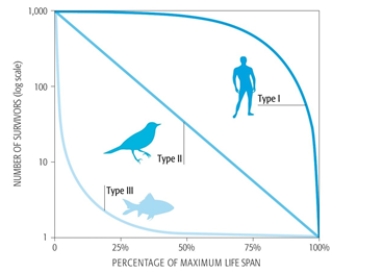
A) Fish have a steady rate of mortality change.
B) Birds have a constant mortality rate.
C) Humans have an increased mortality rate at a young age.
D) Fish have a decreased mortality rate at young age.
E) Birds have an ever decreasing mortality rate.
Correct Answer:

Verified
Correct Answer:
Verified
Q85: In this grassland ecosystem, where is the
Q86: Approximately how many years ago did our
Q87: Match the following terms with the correct
Q88: Most organisms feed on something in their
Q89: According to this figure depicting Niger's population
Q91: Which of the following is an ecological
Q92: Which statement most accurately describes the population
Q93: If a tiger and a lion were
Q94: A kingdom in the hierarchical system of
Q95: What is a result when birth rates