Multiple Choice
Figure 9-3
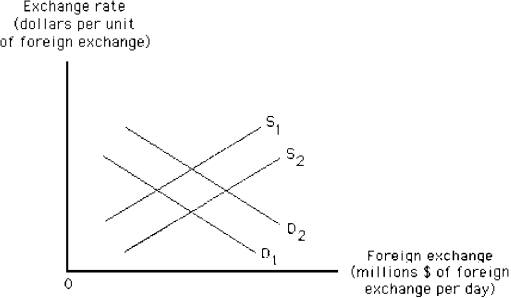
-Suppose that U.S.tastes for British goods increase.Then,in Figure 9-3
A) the supply curve shifts from S₁ to S₂
B) the supply curve shifts from S₂ to S₁
C) the demand curve shifts from D₂ to D₁
D) the demand curve shifts from D₁ to D₂
E) both demand and supply shift to the right
Correct Answer:

Verified
Correct Answer:
Verified
Q13: How does the aggregate goods and services
Q56: If scientific research produces a technological breakthrough
Q66: If you go to the bank and
Q97: Americans needing foreign currencies get those currencies
Q115: The international substitution effect exists because a<br>A)
Q121: Use the figure below to answer the
Q153: A depreciation of a nation's currency would
Q155: Which of the following groups would most
Q161: In the loanable funds market,the true burden
Q203: If the quantity supplied of euro were