Multiple Choice
Use the figure below to answer the following question(s) .
Figure 10-6
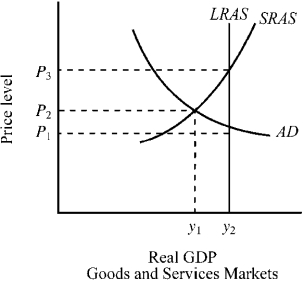
-Given the aggregate demand and aggregate supply curves for the economy depicted in Figure 10-6,the economy's current output and price level are
A) output Y₁ and price level P₂.
B) output Y₂ and price level P₁.
C) output Y₁ and price level P₃.
D) output Y₂ and price level P₃.
Correct Answer:

Verified
Correct Answer:
Verified
Q56: With regard to the business cycle, most
Q97: Which of the following will most likely
Q102: Which of the following will most likely
Q135: In the short run,equilibrium output in the
Q137: Figure 10-18<br> <img src="https://d2lvgg3v3hfg70.cloudfront.net/TB3951/.jpg" alt="Figure 10-18
Q138: Which of the following factors contributed to
Q145: Use the figure below to answer the
Q158: Which of the following would be most
Q175: Since the end of World War II,
Q188: When an economy is temporarily operating at