Multiple Choice
Use the figure below to answer the following question(s) .
Figure 7-6 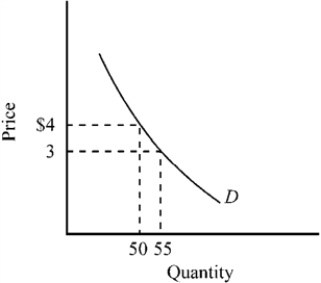
-In the price range between $3 and $4, the price elasticity of the demand curve depicted in Figure 7-6 is
A) highly elastic.
B) approximately equal to −0.33.
C) approximately equal to −3.
D) of unitary elasticity.
Correct Answer:

Verified
Correct Answer:
Verified
Q165: William likes Dr. Pepper and pork sandwiches.
Q166: As the Medicare program is expanded to
Q167: The price elasticity of demand for gasoline
Q168: From the standpoint of economic efficiency, which
Q169: Other things equal, the demand for a
Q171: Figure 7-15 <img src="https://d2lvgg3v3hfg70.cloudfront.net/TB7348/.jpg" alt="Figure 7-15
Q172: Have market forces failed in keeping healthcare
Q173: If the quantity demanded increases by 20
Q174: If the board of regents of a
Q175: Figure 7-16 <img src="https://d2lvgg3v3hfg70.cloudfront.net/TB7348/.jpg" alt="Figure 7-16