Multiple Choice
The figure below illustrates the cost and revenue structure for a monopoly firm.
Figure 11-17
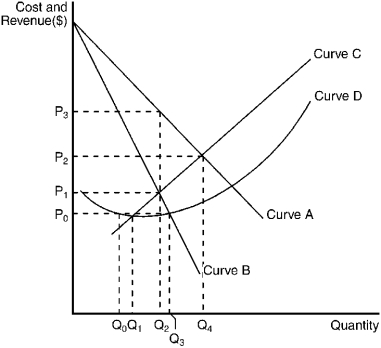
-Refer to Figure 11-17.The demand curve for a monopoly firm is depicted by curve
A) A.
B) B.
C) C.
D) D.
Correct Answer:

Verified
Correct Answer:
Verified
Related Questions
Q10: If mutual interdependence among firms is present,
Q12: When a single firm has control over
Q66: The two conflicting tendencies that a firm
Q81: A monopolist finds out that if he
Q104: Which of the following is true of
Q143: Why does the U.S. government maintain a
Q181: The demand curve facing a monopolist<br>A) is
Q188: Which of the following is a problem
Q203: One of the effects of patents is
Q245: Figure 11-6<br> <img src="https://d2lvgg3v3hfg70.cloudfront.net/TB3951/.jpg" alt="Figure 11-6