Multiple Choice
The figure below illustrates the cost and revenue structure for a monopoly firm.
Figure 11-17
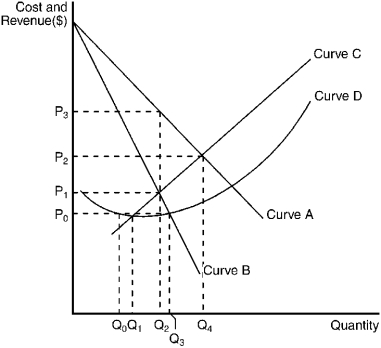
-Refer to Figure 11-17.The marginal revenue curve for a monopoly firm is depicted by curve
A) A.
B) B.
C) C.
D) D.
Correct Answer:

Verified
Correct Answer:
Verified
Q33: Government-operated firms with monopoly power<br>A) will necessarily
Q45: In general, an organization of sellers designed
Q49: Which of the following is true?<br>A) Competitive
Q65: Figure 11-9 <img src="https://d2lvgg3v3hfg70.cloudfront.net/TB7348/.jpg" alt="Figure 11-9
Q93: The Big River Power Company is a
Q146: To maximize profit,the monopolist,whose cost and demand
Q152: Figure 11-12<br> <img src="https://d2lvgg3v3hfg70.cloudfront.net/TB3951/.jpg" alt="Figure 11-12
Q154: Which of the following is the best
Q173: Which of the following reflects the incentive
Q249: Use the figure to answer the following