Multiple Choice
The figure below illustrates the cost and revenue structure for a monopoly firm.
Figure 11-17
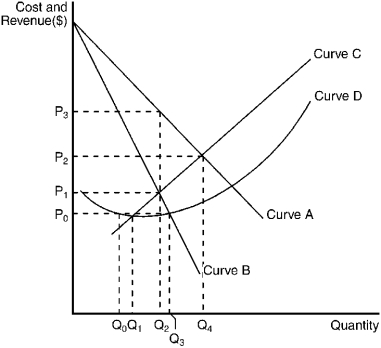
-Refer to Figure 11-17.The marginal cost curve for a monopoly firm is depicted by curve
A) A.
B) B.
C) C.
D) D.
Correct Answer:

Verified
Correct Answer:
Verified
Q1: Figure 11-11<br> <img src="https://d2lvgg3v3hfg70.cloudfront.net/TB3951/.jpg" alt="Figure 11-11
Q26: If marginal cost exceeds marginal revenue, a
Q31: An oligopolistic firm that is deciding the
Q56: "Market power" is an expression used to
Q110: At the long-run equilibrium level of output,
Q123: Which of the following is true of
Q185: Which of the following provides the most
Q207: Use the figure to answer the following
Q216: Which of the following factors is least
Q246: Figure 11-21 <img src="https://d2lvgg3v3hfg70.cloudfront.net/TB7348/.jpg" alt="Figure 11-21