Multiple Choice
The figure below illustrates the cost and revenue structure for a monopoly firm.
Figure 11-17
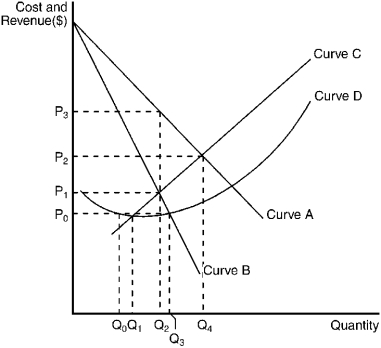
-Refer to Figure 11-17.The average total cost curve for a monopoly firm is depicted by curve
A) A.
B) B.
C) C.
D) D.
Correct Answer:

Verified
Correct Answer:
Verified
Q36: Figure 11-20 <img src="https://d2lvgg3v3hfg70.cloudfront.net/TB7348/.jpg" alt="Figure 11-20
Q120: Economists generally criticize high barriers to market
Q124: Being a monopolist in the market<br>A) guarantees
Q151: Which of the following statements accurately describes
Q157: Which one of the following is the
Q172: Table 11-1<br> <img src="https://d2lvgg3v3hfg70.cloudfront.net/TB3951/.jpg" alt="Table 11-1
Q173: Figure 11-12<br> <img src="https://d2lvgg3v3hfg70.cloudfront.net/TB3951/.jpg" alt="Figure 11-12
Q190: Figure 11-20 <img src="https://d2lvgg3v3hfg70.cloudfront.net/TB7348/.jpg" alt="Figure 11-20
Q248: Cartels are difficult to maintain because<br>A) antitrust
Q258: The demand curve of a monopolist is<br>A)