Multiple Choice
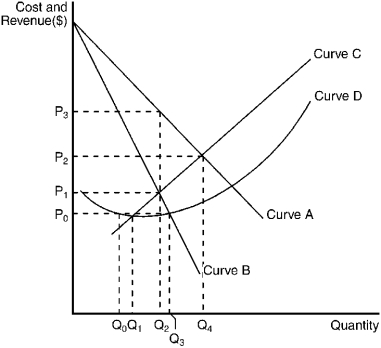
The figure below illustrates the cost and revenue structure for a monopoly firm.
Figure 11-17

-Refer to Figure 11-17.If the monopoly firm wants to maximize its profit,it should operate at a level of output equal to
A) Q₁.
B) Q₂.
C) Q₃.
D) Q₄.
Correct Answer:

Verified
Correct Answer:
Verified
Q45: In general, an organization of sellers designed
Q49: Which of the following is true?<br>A) Competitive
Q64: From the viewpoint of allocative efficiency, which
Q71: The U.S. Postal Service has a monopoly
Q98: Use the figure to answer the following
Q146: To maximize profit,the monopolist,whose cost and demand
Q173: Which of the following reflects the incentive
Q186: Under what conditions can a monopolist have
Q235: "Market power" is an expression used to
Q249: Use the figure to answer the following