Multiple Choice
The figure below illustrates the cost and revenue structure for a monopoly firm.
Figure 11-17
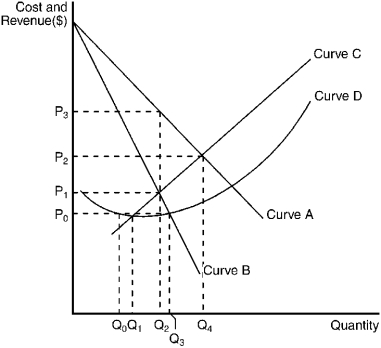
-Refer to Figure 11-17.Profit will be maximized by charging a price equal to
A) P₀.
B) P₁.
C) P₂.
D) P₃.
Correct Answer:

Verified
Correct Answer:
Verified
Related Questions
Q34: Collusion<br>A) is exactly the same thing as
Q73: Compared to the profit-maximizing outcome, average cost
Q75: Which of the following constitutes a barrier
Q109: Empirical studies show that the after-tax accounting
Q122: Which of the following explains why monopoly
Q183: The difficulty in analyzing oligopolistic behavior arises
Q191: Which of the following is true under
Q199: Graphically, the marginal revenue curve of a
Q242: An organization of sellers designed to coordinate
Q254: When barriers to entry are high, a