Multiple Choice
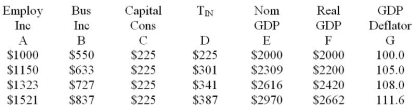
-Refer to Table 5.2. In each case, dividing the sum of the data across columns A to D by the data in column F illustrates _____________ and the _______________.
A) rising expenditures, downward sloping AD curve
B) rising unit costs, upward sloping AS curve
C) constant unit costs, horizontal AS curve
D) falling unit costs, downward sloping AS curve
Correct Answer:

Verified
Correct Answer:
Verified
Q30: The speed with which an economy adjusts
Q31: At the intersection of the aggregate supply
Q32: For any given year the AD/AS model
Q33: Table 5.4: The following aggregate demand and
Q34: The aggregate demand (AD) function of an
Q36: The wealth effect suggests that a:<br>A) lower
Q37: The aggregate supply (AS) function of an
Q38: The equilibrium or natural unemployment rate:<br>A) is
Q39: The potential output curve is vertical because
Q40: A fall in the Canadian price level