Multiple Choice
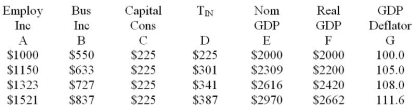
-Refer to Table 5.2. A plot of the AS curve would be a scatter diagram with data from column
____________ on the horizontal axis and corresponding data from column ___________________ on the vertical axis.
A) E, G
B) F, G
C) E, F
D) A, G
Correct Answer:

Verified
Correct Answer:
Verified
Q9: An AD curve is:<br>A) vertical if full
Q10: Table 5.4: The following aggregate demand and
Q11: <img src="https://d2lvgg3v3hfg70.cloudfront.net/TB10399/.jpg" alt=" -Refer to Figure
Q12: If aggregate demand exceeds potential output:<br>A) an
Q13: Higher oil price will shift the aggregate
Q15: <img src="https://d2lvgg3v3hfg70.cloudfront.net/TB10399/.jpg" alt=" -Refer to Figure
Q16: Assume that the natural rate of unemployment
Q17: The substitution effect suggests that a decrease
Q18: The elimination of a recessionary gap without
Q19: <img src="https://d2lvgg3v3hfg70.cloudfront.net/TB10399/.jpg" alt=" -Refer to Figure