Multiple Choice
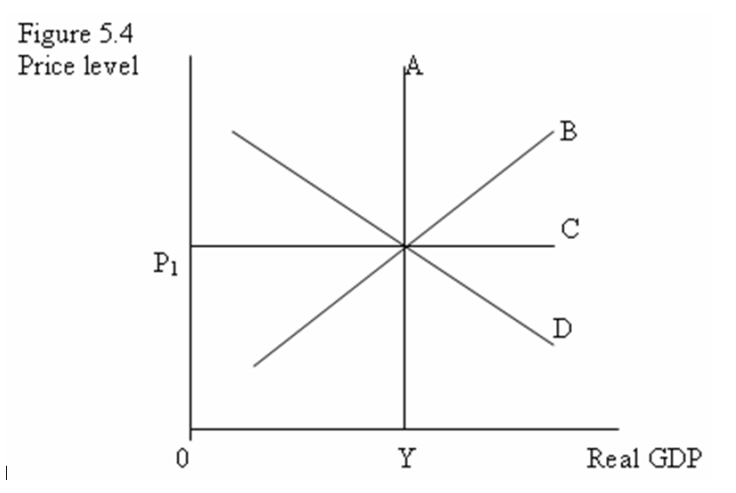
-Refer to Figure 5.4. The equilibrium in AD-AS model at potential output is shown by the intersection of the graphs:
A) A, B, and C.
B) A and B.
C) A and C.
D) A, B, and D.
Correct Answer:

Verified
Correct Answer:
Verified
Q24: The potential output line is vertical:<br>A) because
Q25: <img src="https://d2lvgg3v3hfg70.cloudfront.net/TB10399/.jpg" alt=" -Refer to Figure
Q26: <img src="https://d2lvgg3v3hfg70.cloudfront.net/TB10399/.jpg" alt=" -Refer to Figure
Q27: If equilibrium output is less than potential
Q28: Potential output changes only when:<br>A) the price
Q30: The speed with which an economy adjusts
Q31: At the intersection of the aggregate supply
Q32: For any given year the AD/AS model
Q33: Table 5.4: The following aggregate demand and
Q34: The aggregate demand (AD) function of an