Multiple Choice
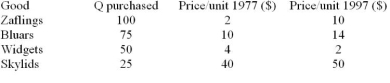 Table 2.1
-Using Table 2.1, in 1977 the greatest share of household income was spent on:
A) bluars.
B) widgets.
C) zaflings.
D) skylids.
Correct Answer:

Verified
Correct Answer:
Verified
Related Questions
Q72: If the CPI for 2005 was 284.1,
Q73: <img src="https://d2lvgg3v3hfg70.cloudfront.net/TB10399/.jpg" alt=" Table 2.2 -Jim's
Q74: Assumptions are used in economic theories in
Q75: Economic theories, like physics or chemistry, can
Q76: Evaluate the following criticism of economic models:
Q78: The slope of a line measures its
Q79: A basket of goods in 1987 cost
Q80: When economists use cross-section data, they collect
Q81: If the weekly earnings index for the
Q82: Solving the equations P = 2 +