Multiple Choice
The following chart represents the results of a two categorical variable study reflecting on education level survey in 2006 and the same survey results from 2016. Which type of chart is being displayed? 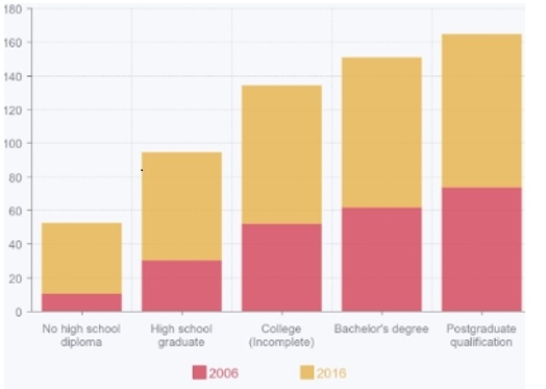
A) scatterplot
B) contingency table
C) histogram
D) stacked column chart
Correct Answer:

Verified
Correct Answer:
Verified
Related Questions
Q26: Below is the Scatterplot of 2 numeric
Q27: Simone is a marketing consultant hired to
Q28: If the coefficient correlation is computed to
Q29: Using R, Bart wants to create a
Q30: Alex is working on an investment portfolio
Q32: The standard deviation of midterm scores and
Q33: In the following Boxplot, the left whisker
Q34: If the correlations coefficient is 0, then<br>A)
Q35: The mean credit score is 645 out
Q36: Using the following table, what is the