Multiple Choice
The cost to make a product is  . The fixed cost per month to make the product is
  . For
. For  Products, a model for the cost per month is
y = {  }x+$4464. The price for each product is
  ) A model for the total revenue
  from the sale of
  products is y = {
  }x. Use the graph of the system to find the break-even point and describe the costs and revenue at the break-even point. Assume that the company will sell all the products.
A) 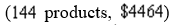
B) 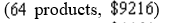
C) 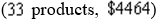
D) 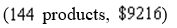
E) none of these
Correct Answer:

Verified
Correct Answer:
Verified
Q57: Solve the system of equations by substitution.<br>-<img
Q58: The graph represents the system of equations
Q59: Write the system of equations in standard
Q60: The graph represents the system of equations
Q61: Represent the system of equations with an
Q63: Graph the system of linear inequalities. Label
Q64: Represent the system of equations with an
Q65: Solve the system of equations using elimination,
Q66: A company that manufactures gas grills sells
Q67: Use the system of inequalities. <img src="https://d2lvgg3v3hfg70.cloudfront.net/TB10230/.jpg"