Multiple Choice
Use the bar graph.
The bar graph shows the number of tornado reports each decade since the 1950s
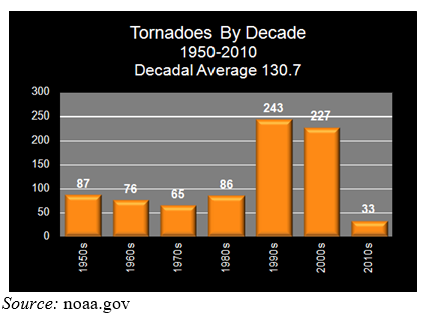
-Use roster notation to represent the domain of the relation.
A) 
B) 
C) 
D) 
E) none of these
Correct Answer:

Verified
Correct Answer:
Verified
Q6: A salad recipe calls for 3 lbs
Q7: Use the absolute value function <img src="https://d2lvgg3v3hfg70.cloudfront.net/TB10230/.jpg"
Q8: Use the graph of <img src="https://d2lvgg3v3hfg70.cloudfront.net/TB10230/.jpg" alt="Use
Q9: The vertex of a quadratic function is
Q10: Use the graph. <img src="https://d2lvgg3v3hfg70.cloudfront.net/TB10230/.jpg" alt="Use the
Q12: Use algebra to find all real zeros
Q13: Use the function <img src="https://d2lvgg3v3hfg70.cloudfront.net/TB10230/.jpg" alt="Use the
Q14: Use the given graph of a quadratic
Q15: Use the function <img src="https://d2lvgg3v3hfg70.cloudfront.net/TB10230/.jpg" alt="Use the
Q16: Use the graph of <img src="https://d2lvgg3v3hfg70.cloudfront.net/TB10230/.jpg" alt="Use