Multiple Choice
Use the bar graph.
The bar graph shows the number of tornado reports each decade since the 1950s
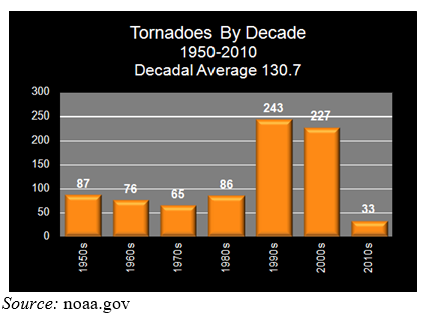
-Use roster notation to represent the range of the relation.
A) 
B) 
C) 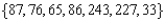
D) 
E) none of these
Correct Answer:

Verified
Correct Answer:
Verified
Q25: Use the absolute value function <img src="https://d2lvgg3v3hfg70.cloudfront.net/TB10230/.jpg"
Q26: Identify the vertex of the function <img
Q27: Which of the graphs represents a function?
Q28: A rancher has a 5000-gallon water tank
Q29: A new company purchases $42,000 of computer
Q31: At 5:00 AM the temperature outside was
Q32: Write the equation of the line that
Q33: Find the function that represents the graph
Q34: For the function <img src="https://d2lvgg3v3hfg70.cloudfront.net/TB10230/.jpg" alt="For the
Q35: Find the slope of the line that