Essay
Wally's Window Emporium is a leading producer and provider of residential windows across the United States. They just completed their second year of operations and compiled the following data: 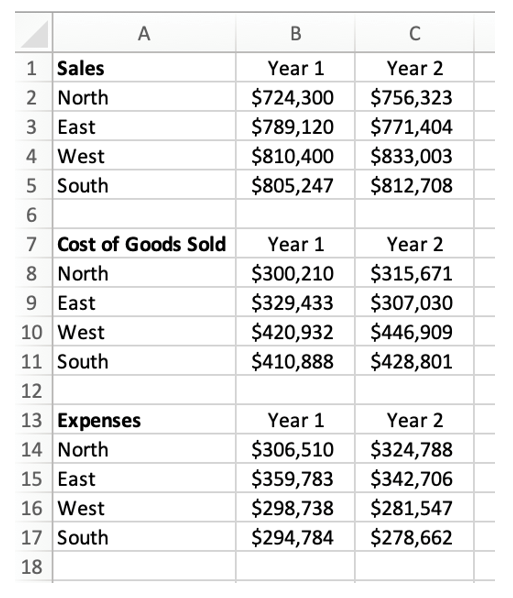 Management feels overwhelmed when they look at the data in this format, and they do not feel comfortable making decisions for the upcoming year until the data is easier to understand. The analytics team needs to present this information in a more user-friendly fashion so management can make data-informed decisions. With this information in mind, please answer the following questions.
a. What was the Gross Profit Percentage for each region for Year 2? What was the Net Income Percentage for each region for Year 2? (Round your answers to two decimal places.)
b. Which region had the largest percentage increase between years for Sales, Cost of Goods Sold (COGS), and Expenses? (Round your answers to two decimal places.)
c. What kind of graph would be most useful to display a comparison of net incomes for each region for Year 2? Create this graph.
Correct Answer:

Verified
Correct Answer:
Verified
Q1: Sharon is the marketing manager for Smith
Q3: Sampson Inc. is a producer of plastic
Q4: Trevor is about to enter his third
Q5: Houz Inc. is a regional furniture manufacturer
Q6: Companies that collect data from their users
Q7: Data analytics has become a very high-demand
Q8: As companies integrate data analytics and shift
Q9: Sarah works for a mid-size law firm
Q10: As companies continue to embrace the evolution
Q11: The field of data analytics has become