Essay
Starling Corporation completed their fifth year of operations as a manufacturer of chalkboard paint. Starling has seen growth in sales. But they have concerns about whether their spending is higher than they would like it to be. As part of their annual review process, management would like to put together some data and analyze it to create some visuals that better illustrate their performance over the year. The accounting department compiled the following data for the previous five years: 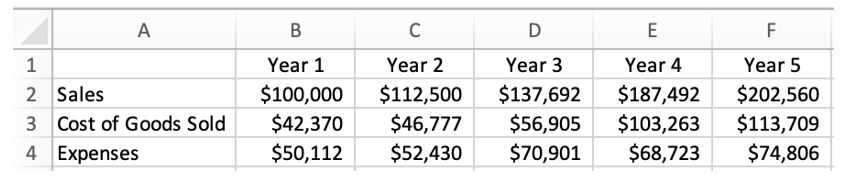 Management asked the analysts to help in this year's review and will need the information compiled within the next week. With all of this in mind, please assist Starling by answering the following questions. Use Excel where appropriate.
a. What is the average value for Sales over those five years? What is the average Cost of Goods Sold for five years? What were the average Expenses for five years? (Round your answers to whole number.)
b. What is the Gross Profit percentage for each year? What are the Net Income percentages for each year?
c. To visually depict this information, Starling would like to create a graph. Which type of graph is most appropriate, and why? Create the graph you just mentioned.
d. Based on the analysis and graph you provided so far, what observations can you make about Starling Corporation? Is there any advice you would like to give management to help them move forward?
Correct Answer:

Verified
a. Average Sales per year: $148,049; Ave...View Answer
Unlock this answer now
Get Access to more Verified Answers free of charge
Correct Answer:
Verified
View Answer
Unlock this answer now
Get Access to more Verified Answers free of charge
Q100: Windows R Us is a nationwide producer
Q101: A public university has been evaluating its
Q102: Artemis Inc. is a major producer of
Q103: Rhoades Corp. is a law firm. They
Q104: Companies doing business in the modern era
Q106: A company investigates what types of data
Q107: Rhoades Corp. is a law firm. They
Q108: Using data analytics in cost accounting is
Q109: As consumers have increased their use of
Q110: Wally's Window Emporium is a leading producer