Multiple Choice
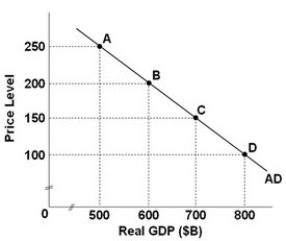
- Refer to the above graph, which shows an aggregate demand curve for a hypothetical economy. If the price level is 200, the quantity of real GDP demanded is:
A) $500 billion.
B) $600 billion.
C) $700 billion.
D) $800 billion.
Correct Answer:

Verified
Correct Answer:
Verified
Q23: The following list contains factors that are
Q24: A rightward shift of the aggregate demand
Q25: The following list contains items that are
Q26: <img src="https://d2lvgg3v3hfg70.cloudfront.net/TB9951/.jpg" alt=" - Refer to
Q27: When there is an increase in aggregate
Q29: <img src="https://d2lvgg3v3hfg70.cloudfront.net/TB9951/.jpg" alt=" Refer to the
Q30: A change in household indebtedness will cause
Q31: If the U.S. dollar appreciates in value
Q32: The following list contains factors that are
Q33: When the price level falls:<br>A) the demand