Multiple Choice
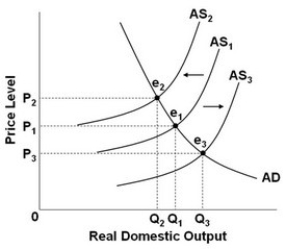
- Refer to the above diagram. When output decreases from Q1 and the price level increases from P1, then this change will:
A) be caused by a shift in the aggregate supply curve from AS1 to AS3.
B) be caused by a shift in the aggregate supply curve from AS2 to AS1.
C) result in a movement along the aggregate demand curve from e2 to e1.
D) result in a movement along the aggregate demand curve from e1 to e2.
Correct Answer:

Verified
Correct Answer:
Verified
Q1: Which of the following statements about the
Q3: Which set of events would most likely
Q4: The shape of a short-run aggregate supply
Q5: If the prices of imported resources increase,
Q6: A fall in prices of imported resources
Q7: A graph of the long-run aggregate supply
Q8: Which would be one of the factors
Q9: If Congress raised taxes on businesses, this
Q10: An aggregate supply curve shows the:<br>A) level
Q11: An increase in aggregate supply increases the