Multiple Choice
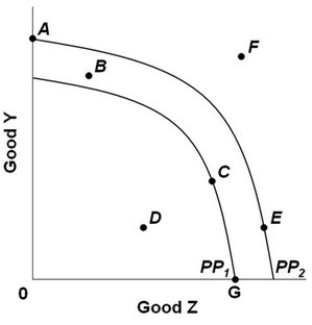 The graph above shows two production possibilities curves for a nation that produces two goods, Y and Z. PP1 and PP2 show the production possibilities for years 1 and 2. The nation's total production then decreased after year 2. This change could be represented by a move from:
A) F to A.
B) A to E.
C) F to B.
D) E to D.
Correct Answer:

Verified
Correct Answer:
Verified
Q11: Suppose there are two economies, Alpha and
Q12: <img src="https://d2lvgg3v3hfg70.cloudfront.net/TB9951/.jpg" alt=" - Refer to
Q13: Economics is the study of the efficient
Q14: If an economy is producing at a
Q15: If an economy that produces capital and
Q16: According to the Zuckerberg, Seacrest, and Swift
Q17: Assume that for Indy, one hour of
Q18: The following economy produces two products.<br><img src="https://d2lvgg3v3hfg70.cloudfront.net/TB9951/.jpg"
Q20: <img src="https://d2lvgg3v3hfg70.cloudfront.net/TB9951/.jpg" alt=" -Refer to
Q21: Which statement is an economic rationale for